Every target.
One workspace.
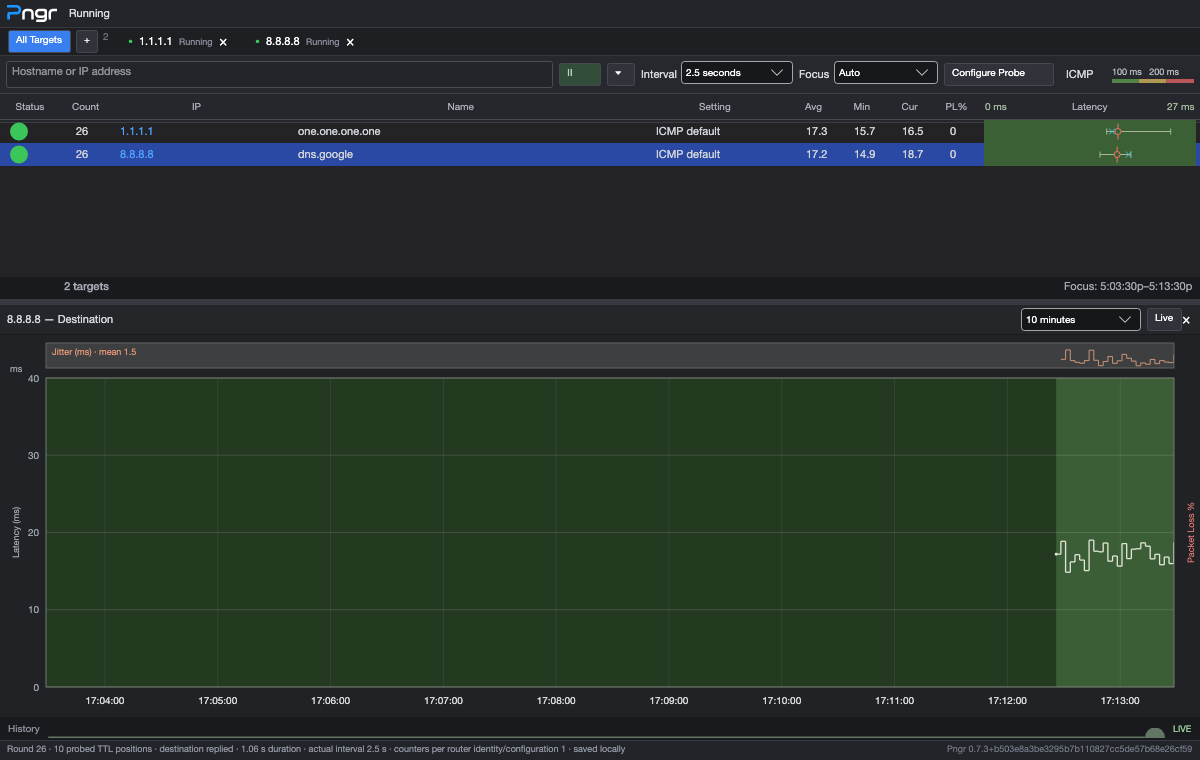
Monitor multiple destinations independently. Pause, resume, and compare connections without losing your place.

NETWORK DIAGNOSTICS, IN FOCUS
Follow every hop. Catch every spike.
Know where your connection
stands.
macOS & Windows · No cloud account required
LIVE SIGNAL. LOCAL HISTORY.
Live latency, jitter, and diagnostic response loss.
All on a
timeline you can explore.
LESS GUESSWORK. MORE SIGNAL.
Monitor multiple destinations independently. Pause, resume, and compare connections without losing your place.
Switch between ICMP, TCP, and UDP. Save probing profiles with the intervals and settings your network needs.
Pan and zoom synchronized graphs. Select an interval, compare hops, and revisit saved sessions.
Response loss measures missing diagnostic replies; intermediate routers may limit replies while still forwarding traffic.
ON YOUR DESKTOP. ON YOUR TERMS.
Session history stays locally on your computer.
No cloud
account. No background monitoring service.
Saved workspaces, profiles, and sessions.
Route-change events and optional alerts.
Optional read-only localhost API, off by default.
READY WHEN YOU ARE
Pngr 0.7.3 · Standalone desktop app · Runtime included
macOS 15 or later
Apple Silicon & Intel · Universal app
Windows 11
64-bit Intel & AMD · Per-user installation
Installers are unsigned; macOS builds are not notarized. Your operating system may show a security prompt.