
Pngr documentation
Install Pngr, monitor connections, and read your network diagnostics with confidence.
Pngr is a desktop network diagnostics application for macOS and Windows. Monitor destinations with ICMP, TCP, or UDP, compare network hops, and explore session history stored on your computer.
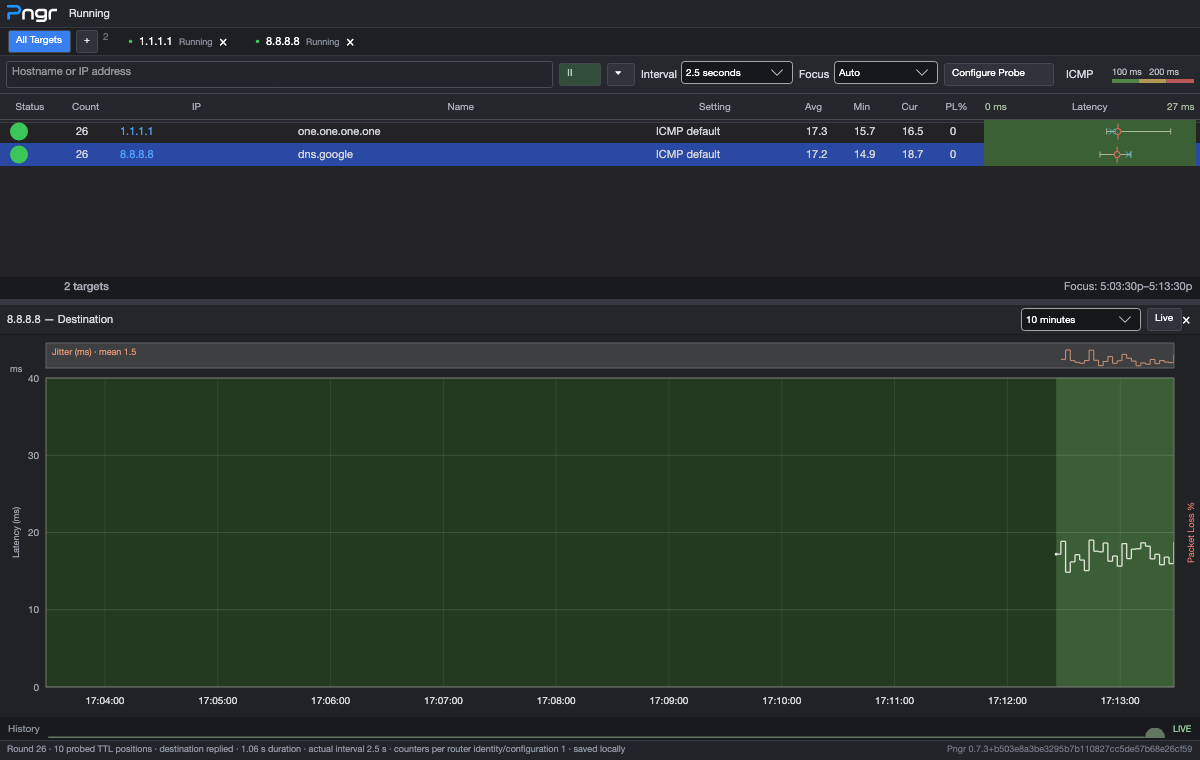
Start monitoring
- Install Pngr.
- Follow the quick start to create a monitoring target.
- Learn what latency, response loss, and jitter tell you.
Read diagnostic loss carefully
Missing diagnostic replies do not establish forwarding loss. A router can suppress replies while forwarding traffic normally. Compare downstream hops and destination measurements before drawing conclusions.
Explore the application
- Network Monitoring: choose protocols, tune probes, understand routes, and organize targets.
- Graphs & History: inspect hop latency, navigate timelines, reopen sessions, and export measurements.
- Settings: configure monitoring, display, storage, alerts, and optional local access.
- Advanced Features: create alert rules, choose interfaces, maintain data, and use the read-only API.
- Application Management: check for updates, install them, uninstall, and troubleshoot.
Local by default
No cloud account or background monitoring service is required. Closing Pngr stops monitoring and the optional local API. Your settings, workspace, profiles, and session history remain in your local data directory.